기존에 테스트 했던 실시간 웹페이지 그래프 출력 테스트는 자바스크립트를 이용하여 그래프를 출력 했는데 CSS 코드만으로 그래프를 출력 할수 있도록 했다. 좀더 심플하고 빠르게 반응할수 있도록 했다.
https://youtube.com/shorts/xl4ieCCOBx4
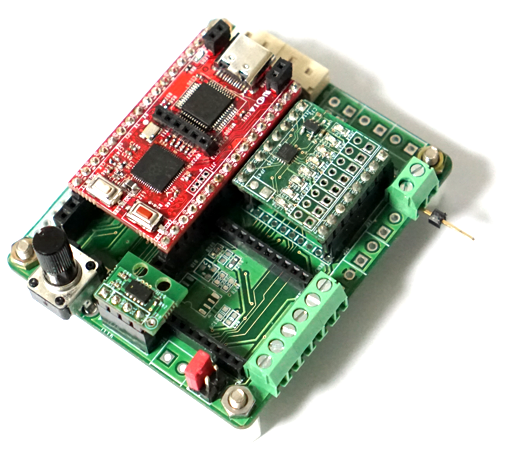
RP2350 VL53L0x, PCF8574 거리 측정 테스트 코드를 이용해서 거리 측정 결과를 실시간으로 웹페이지에 출력하는 예제를 테스트해 보자
먼저 페이지 요청이 올때마다 거리 감지센서 VL53L0x의 거리 값을 읽어와 업데이트 할수 있도록 수정하자.
int ReadDistance(void)
{
	int disp[] = {1,3,7,0xf,0x51f,0x3f,0x7f,0xff};
	int i, distance;
	delay(20);

    distance = sensor.readRangeContinuousMillimeters();
    if(distance>2000)
    {
      distance = 2000;
    }

  	Serial.println(distance);

  	i = distance/64;
  	if(i>7)i=7;

  	write8(PCF_8574_ADDR, ~(disp[i] ));

	return distance;
}


void handleReadVal()
{
 String POTval = String(ReadDistance());
 Serial.println(POTval);
 server.send(200, "text/plane", POTval);
}
그래프 출력 부분은 CSS 코드를 수정해서 그래프를 출력 할수 있도록 했다.
<!DOCTYPE html>
<head>
  <title> Real-time ADC Value </title>
  <style>
    body {
      background: black;
      margin: 0;
      display: flex;
      justify-content: center;
      align-items: center;
      height: 100vh;
      overflow: hidden;
      flex-direction: column;
    }

    #ADCValue {
      position: absolute;
      top: 20px;
      left: 50%;
      transform: translateX(-50%);
      color: white;
      font-size: 30px;
      z-index: 10;
    }

    .btn {
	  position: relative;
	  top: 50px;
	  left: 120px;
      #background-color: #2ecc71;
	  background-color: #3498db;
      color: white;
      padding: 15px 30px;
      font-size: 1.0rem;
      border: none;
      border-radius: 5px;
      cursor: pointer;
      margin-top: 20px;
    }

    canvas {
      display: block;
    }
  </style>
</head>
<body>

  <h1 id="ADCValue">0 mV</h1>

  <canvas id="waveCanvas"></canvas>

  <script>
    var adcValue = 0;
    var dataPoints = [];
    var maxDataPoints = 50;
    var count = 0;
    var scrollSpeed = 5;

	var AxesY_Margen = 50;

    const canvas = document.getElementById("waveCanvas");
    const ctx = canvas.getContext("2d");
    canvas.width = window.innerWidth;
    canvas.height = window.innerHeight;


    function drawAxes() {
      ctx.beginPath();
      ctx.moveTo(50, canvas.height / 2);
      ctx.lineTo(canvas.width - 50, canvas.height / 2);
      ctx.strokeStyle = "gray";
      ctx.lineWidth = 2;
      ctx.stroke();


      ctx.beginPath();
      ctx.moveTo(AxesY_Margen, 50);
      ctx.lineTo(AxesY_Margen, canvas.height - 50);
      ctx.stroke();


      var tickSpacing = 50;
      for (let i = 0; i < canvas.width / tickSpacing; i++) {
        let x = 50 + i * tickSpacing;
        ctx.beginPath();
        ctx.moveTo(x, canvas.height / 2 - 5);
        ctx.lineTo(x, canvas.height / 2 + 5);
        ctx.stroke();


        ctx.fillStyle = "gray";
        ctx.font = "16px Arial";
        ctx.fillText(i * 100, x - 10, canvas.height / 2 + 20);
      }


      var yTickSpacing = 80;
      for (let i = -5; i <= 5; i++) {
        let y = canvas.height / 2 - i * yTickSpacing;
        ctx.beginPath();
        ctx.moveTo(AxesY_Margen - 5, y);
        ctx.lineTo(AxesY_Margen + 5, y);
        ctx.stroke();


        ctx.fillStyle = "gray";
        ctx.font = "16px Arial";
        ctx.fillText(i * 100, AxesY_Margen + 10, y + 5);
      }
    }

    drawAxes();
  </script>
</body>
</html>
수정된 코드로 출력되는 그래프 표시 페이지
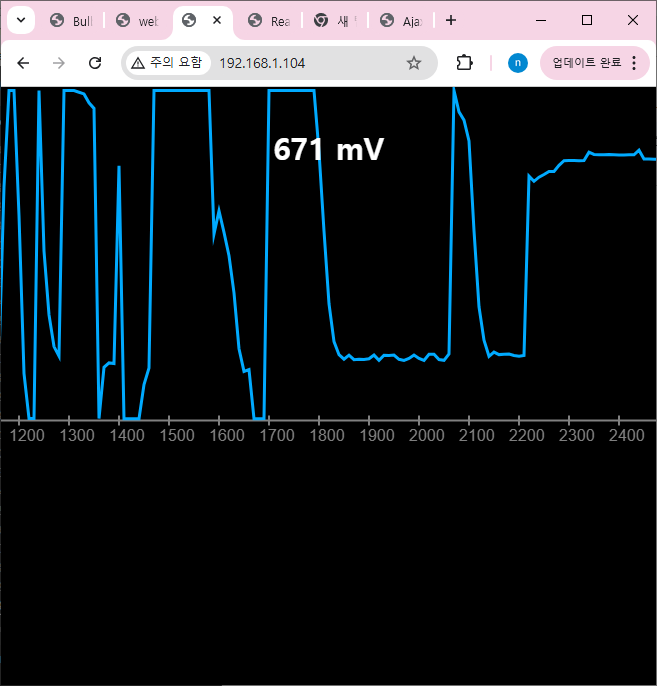
반응형


